

Welcome back to Creator Tips and Tricks! In our last article for the Self-Promotion and Marketing series, we learned about UTMs, custom links to give us more data about the users who read and visit our comic pages. These links are custom-made and give us data about where readers come from, how many used the link, and how many pages they’ve read.
Combined with GlobalComix Analytics:
- We can look at the performance of our marketing campaigns to bring in readers.
- We can look at Page Reads over time, Daily, Weekly, Monthly, etc to look for trends.
- We can look at each pages’ performance to check for the series’ quality and how readers actually engage with your individual pages versus how we think they will.
With that intro out of the way, let's dig into GlobalComix Analytics, where they are, how to read them, and how they benefit YOU, the creator.
Where do I find my GlobalComix Analytics?
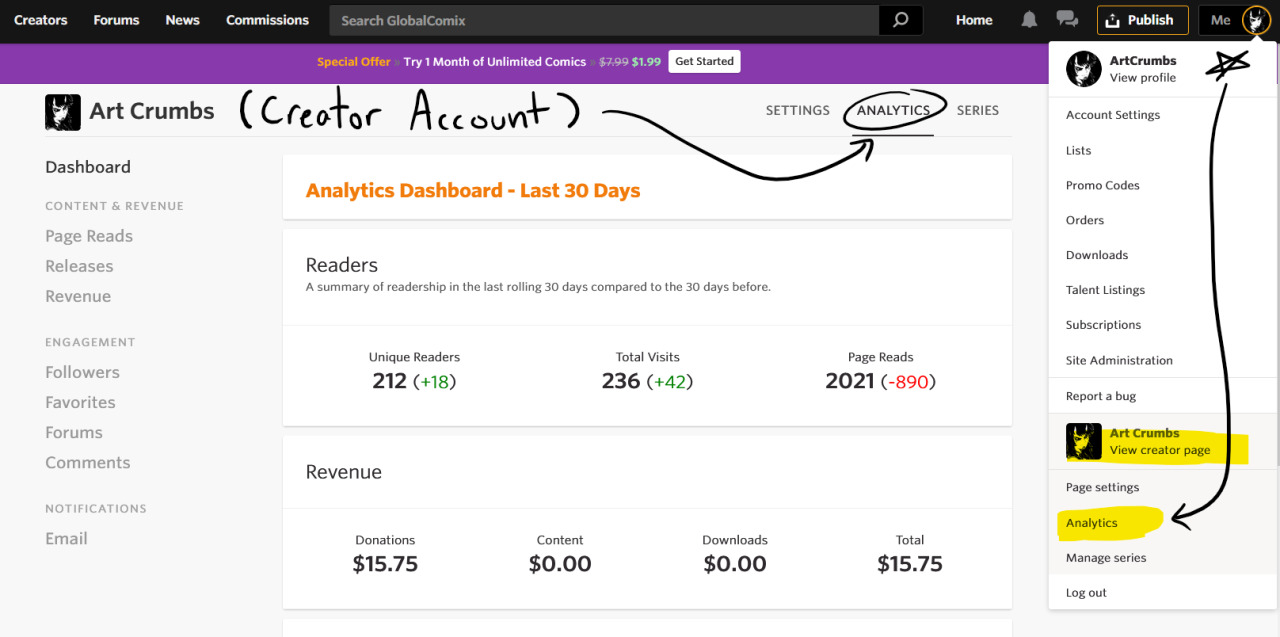
You can find your GlobalComix Analytics within your Creator account. You can open the settings for your Creator account and click on "Analytics" and you'll be taken to your Dashboard.
Additionally, you can click on the icon in the upper right corner of any GlobalComix page, hover down to the Creator section and click on "Analytics". This will also take you the the Dashboard.
Let's take a look at the different sections located within the Dashboard.
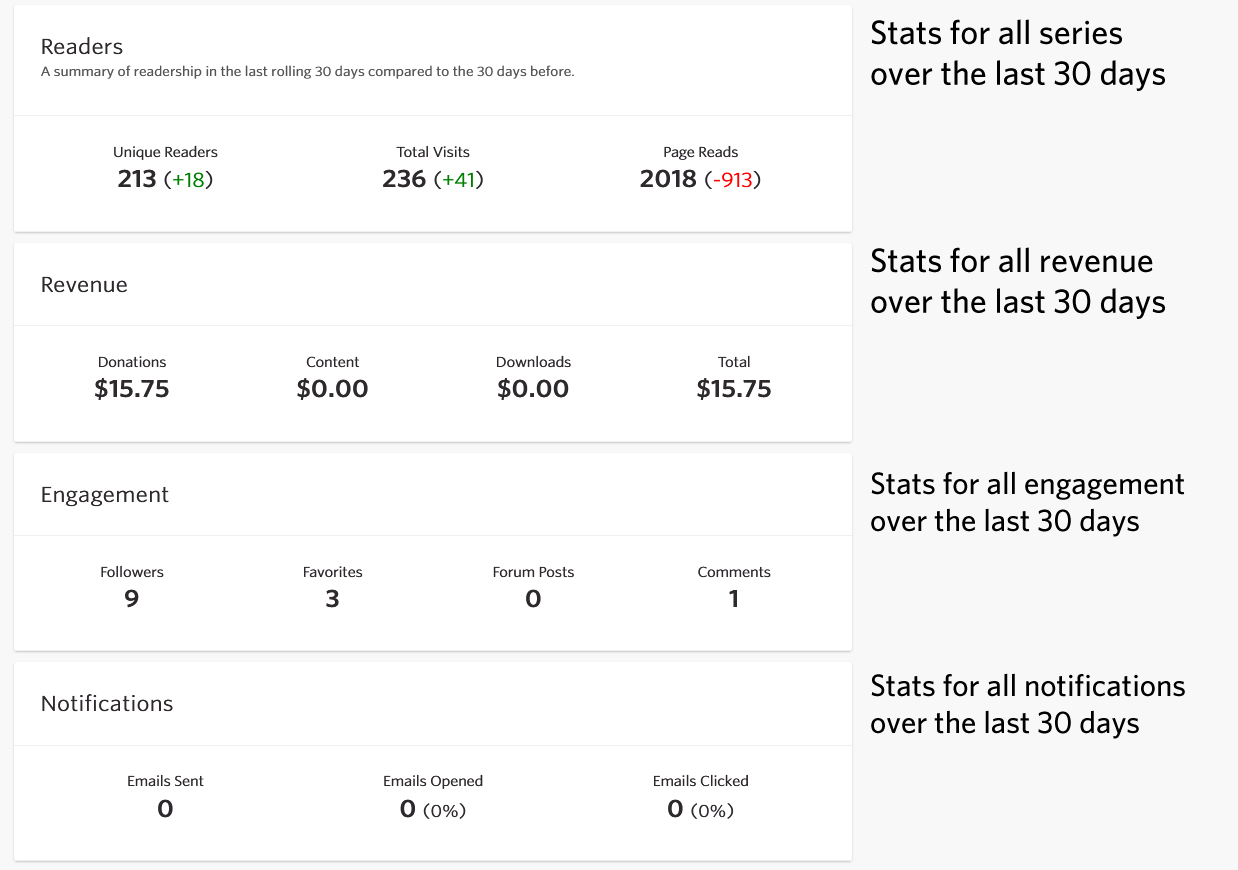
These first two sections are obviously the most exciting, but what do all of these mean? Let's break it all down!
1. Readers:
- Unique Readers: Exactly as it sounds, all unique readers/addresses that looked/read pages of your comic.
- Total Visits: This is the number of users that visited your series, reading or not and does includes duplicates.This number can be important for understanding conversion rate from visitors to readers.
- Page Reads: Total Number of Page reads for this period.
2. Revenue:
- Donations - Revenue from donations to your creator account (must be enabled to receive).
- Content - Revenue from paid-page views / Gold Subscribers
- Downloads - Revenue from PDF Downloads
3. Engagement:
- New Followers, New Favorites, Comments on Forum Posts and Comments on your releases
4. Notifications:
- Emails sent out due to Notifications
- Emails that were opened
- Emails that the reader clicked on to open the release
Now that we've got an idea of how the Analytics Dashboard works, we can take a look at some of these in more detail. The two sections we want to focus on are located on the left bar: Page Reads and Releases.
Page Reads Analytics Graphs
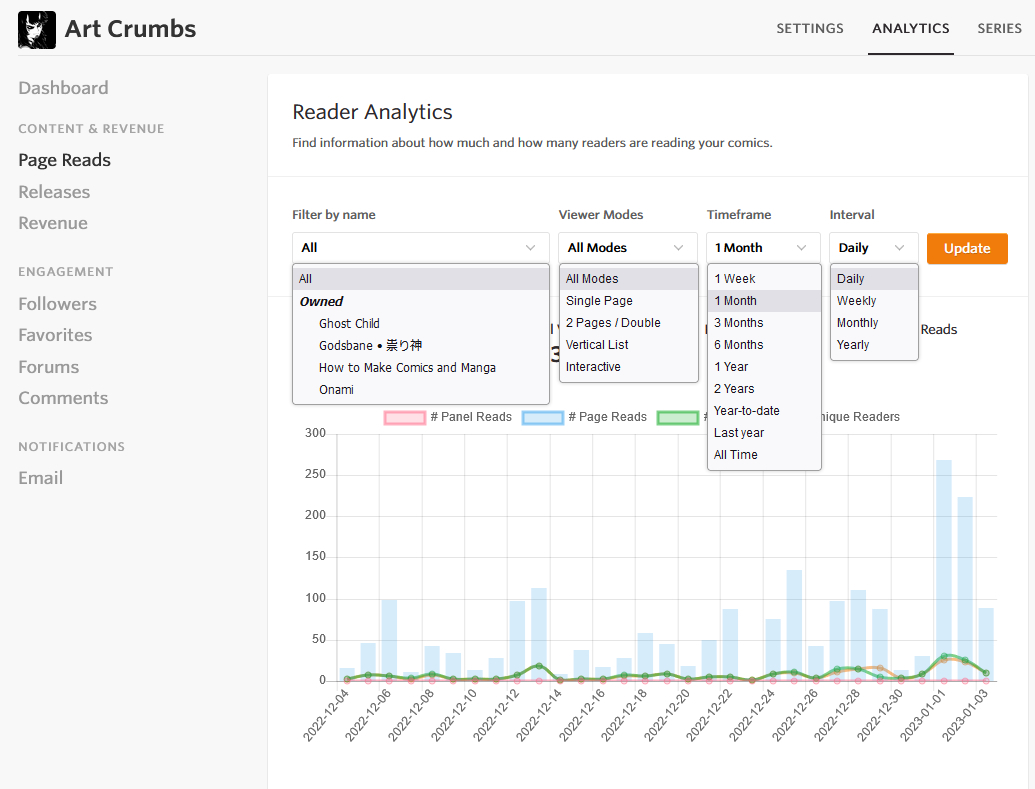
The first thing you'll probably notice looking at this page is the various drop down menus above the graph, so let's look at this. Within the page reads analytics, we can filter down the results that display on the graph. This allows us to look for very specific data. We can filter results by
1. Which comic and which release
2. Which reading mode viewers have used to read your comic or manga
3. How many days / weeks, months of data you'd like to look at
4. How to break up that time frame, for example daily numbers, weekly numbers, etc.
As far as which data set is best, that's up to you! It depends on how often you update and how long you've been on the platform. For example, Godsbane, my manga, has been on the platform for about 9-10 months so selecting "1 Year" would be sufficient. However, Onami is almost 2.5 years old. I would need to select "All Time" in order to see all of its data.
Looking at the graph itself, we have some neat features here. Notice the previous graph had blue vertical bars (representing page reads) and pink plot points, representing interactive panel reads. I've turned those off by clicking on the item above the graph. Notice that both items are crossed out now). This allows users to look at only the data they want at any given time. You can turn them back on by clicking on them again. If you hover over any of the unique plot points, you'll get the date it applies to and the actual number. You don't have to guess and eyeball it!
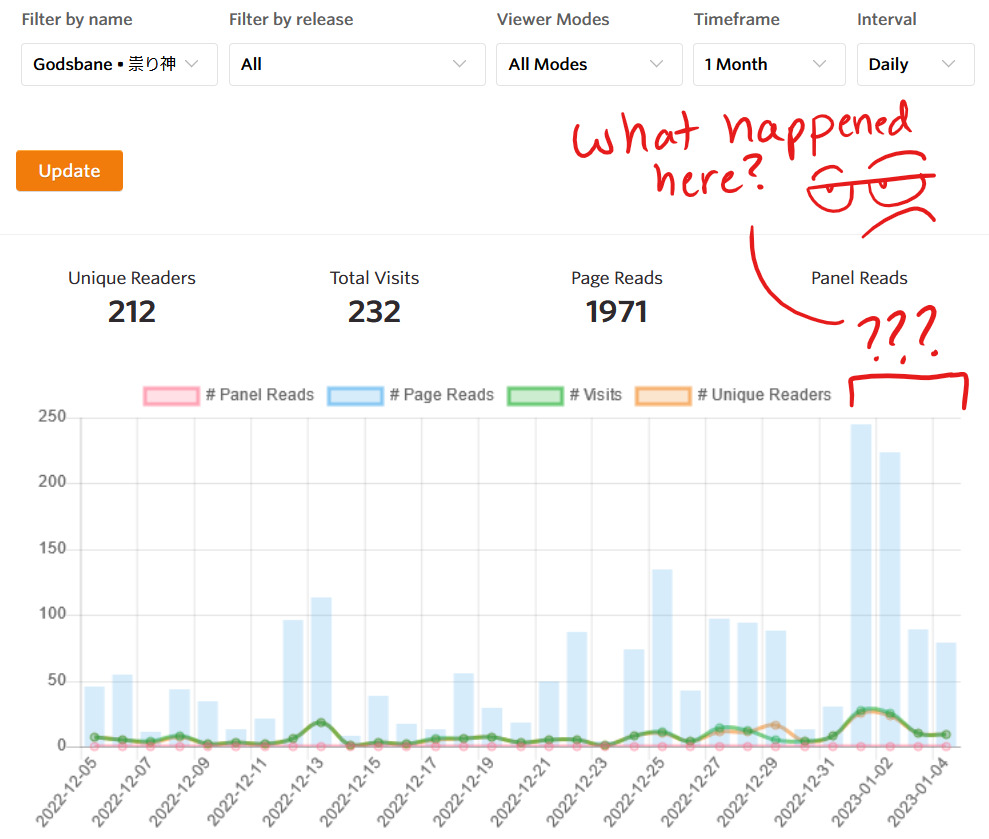
You can customize this graph at any time, and I've found these graphs very helpful to identify where boosts came from! Looking at my current graph, I got a really large boost of viewers on the first and second of January. How do we do find out what caused that? Well, we can scroll below the graph to a section called "Acquisition Sources" and we can find out!
Acquisition Sources
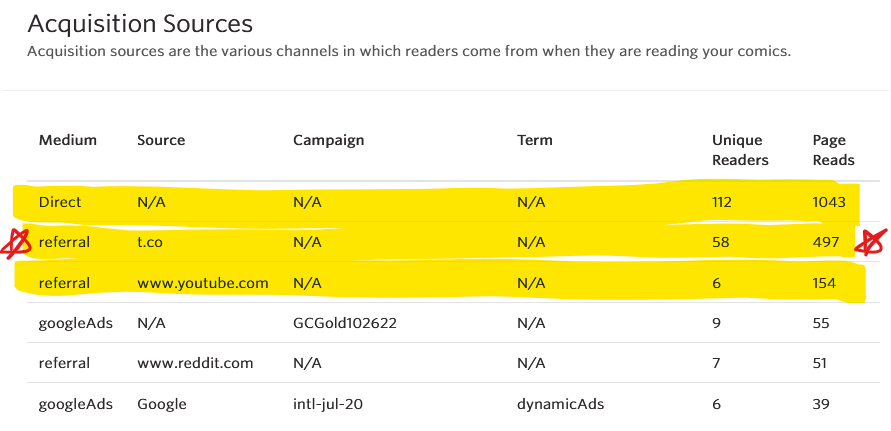
Acquisition sources could also be looked at as "traffic sources". In our last article, we were able to clarify what all of these sections, Medium, Course, Campaign, and Term mean and how they can affect the Acquisition sources. Looking at my list, none of these sources are large enough to cause the almost 500page reads other than the top 3. It's very possible that these contributed, but which one caused it? Or was it all three? Because I track my sources very carefully, I noticed that my "t.co" (Shortened twitter links) was unusually high, both for readers and page reads. In this case, it would be worth checking my Twitter Analytics for something that might have gotten higher engagement than normal!
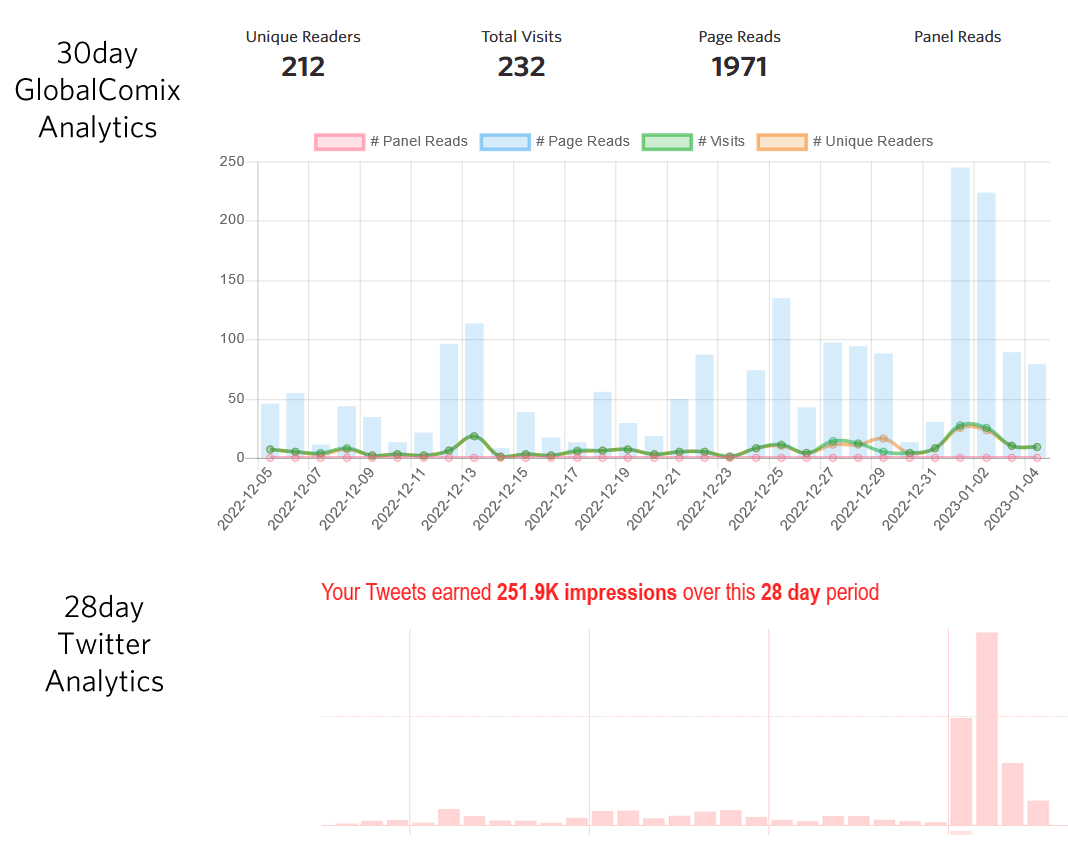
When we look at the analytics for the last 30 days on GlobalComix and last 28 days on Twitter Analytics, we can see there is a notable jump on the same days. So there is definitely something worth looking into here! If we look into my Top Tweets, we can find what happened.
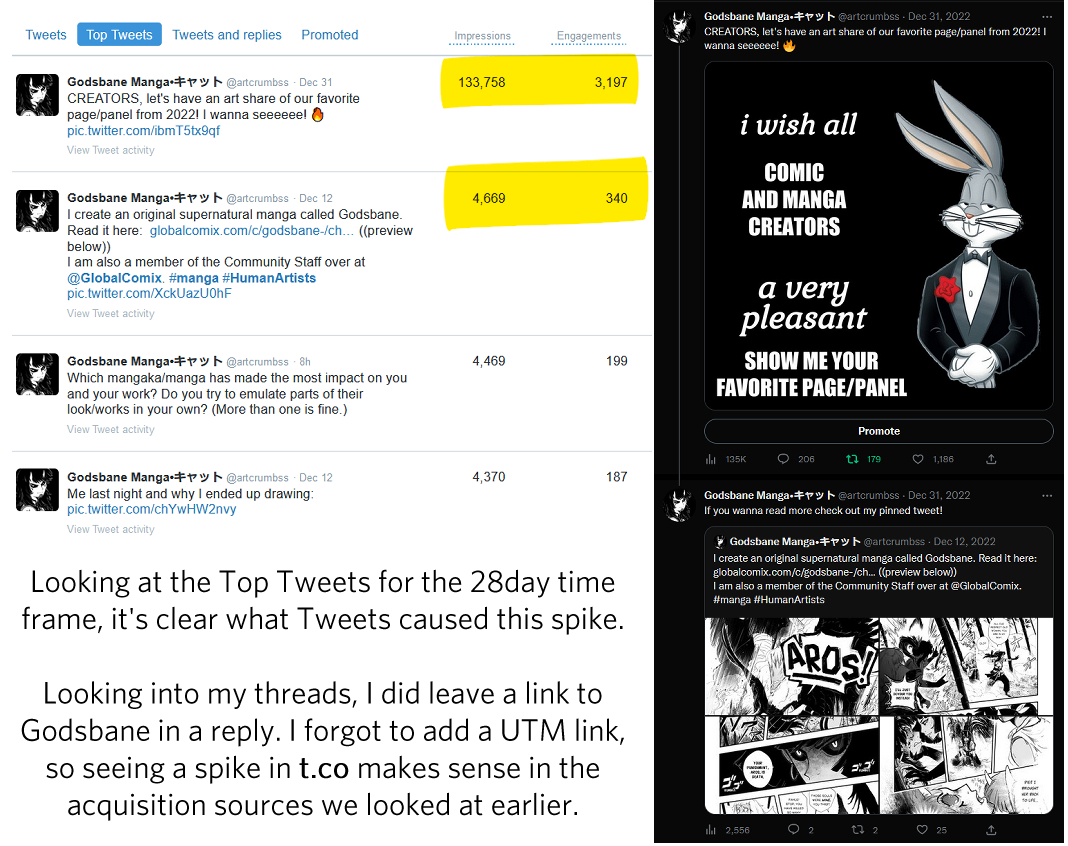
Being able to analyze your stats and be able to make inferences and point out where readers are coming from is going to be really critical to your success using various self-promotion techniques. It'll let you know if your campaigns area accomplishing your task. It's also a fantastic way to find out of other methods paid off and give you clues. In my particular example, creating an artshare was incredibly helpful (if unintentional) to my reading. My intentions were just to create a fun art share at the end of 2022. However, it worked out really well for getting exposure for my own work as well.
My conclusion here, is that hosting art shares is beneficial for the community and for myself. I gained about 50 followers from this as well as over 500 page reads in the span of about 4 days since that post. It would be worth my time to look into hosting more shares like this. It'll benefit everyone to do things like this. I can also look into other community initiatives.
Release Analytics
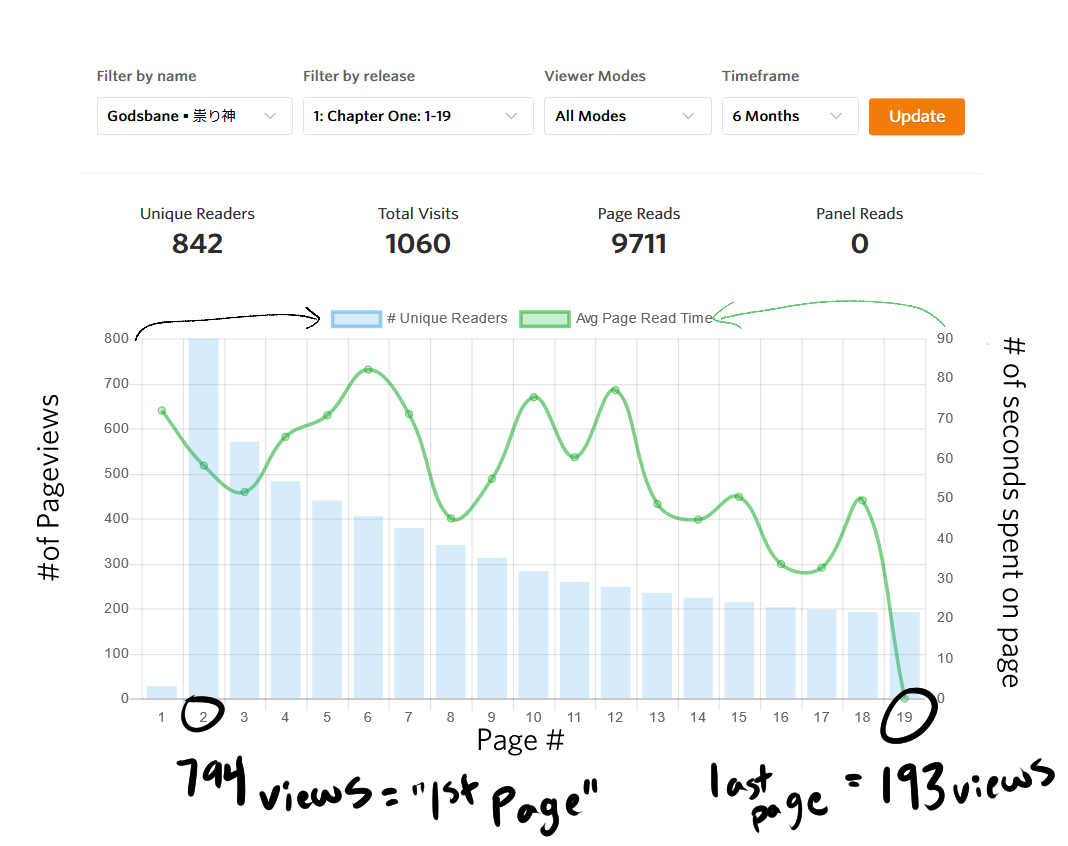
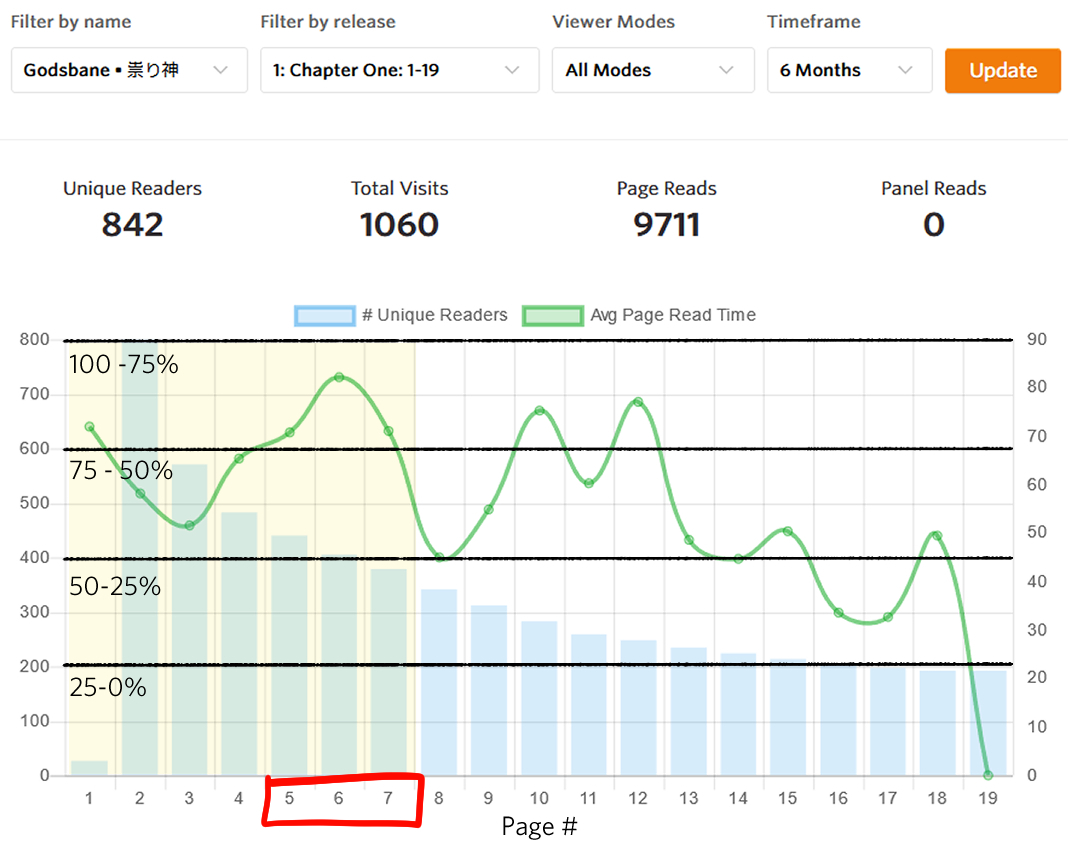
Release analytics look at your individual pages, both page view count within the given time frame and the average page spent on that page. The above data from my first release contains the last 6 months worth of data. The first odd part you might notice is the weird first page count. This page was added a few days before this article. Initially, my release didn't include a chapter cover. Now it does, and the new-ness of this page is reflected in the data, it's only gotten about 20 page views since it was uploaded, meanwhile the next page has been uploaded since I launched this release. It has 794 page views.
Another part of this graph is the Average Read time, this looks at the average time spent on this page. I've found this to be very helpful information for editing my releases and pages over time. Typically, you want to see a steady and very slow decline in the number of page views on each page. The more readers that make it to the next page, the better, obviously. But what about retention or completion rate?
You can get this number by taking your last page pageviews divided by your first page pageviews, and then multiply that result by 100. For example:
193 ÷ 794 = 0.243
Now we want to take 0.243 and multiply it by 100.
0.243 x 100 = 24.3
This number is the percent of people that finished my first release after starting it, 24.3%. In this particular case, I didn't include that first page as it was added later on. It would skew the data to include it now.
What is a good or average completion rate to look for?
General retention/completion rate for an issue/volume in comics is about 20 to 30%. According to this release, my manga is right there in the middle of average at 24.3%. However, I do still want to improve it! If you can get a number higher than 30% as your average retention rate, you are doing fantastic and should be very proud of yourself! However, if you are under 20%, it might be worth looking into to figure out why you have a lower than average completion. If you want to improve, no matter what your rate is, how do you do that?
It could be a lot of factors affecting performance. It could be there is confusion in the story, or unclear paneling/dialogue and readers are dropping off. If there is a particular page that is causing confusion, there might be a dramatic change between pages, and not smooth/gradual. The only page that should have a large decline between pages is the Cover to first page. In an interview, even a Jump Editor said that it isn't unusual to see a 20-35% drop at the beginning of a series within the first page or two. Readers might be bookmarking it for later, they might open the tab and save it for later or forget. Readers also might open the series and for whatever reason decide not to read afterall.
If you see the 20-35% drop at the beginning, you shouldn't be alarmed.
I myself have about a 25-30% drop from the (original) first page to the second. We'll see over time if this new cover will end up being the same, or if it might have a better (less severe) drop off than the original first page. If you see a drop off much smaller than that 20%, that's fantastic! You're doing great. Be proud of your awesome work! Try to figure out what made it so successful and try to replicate that in future releases!
The last part of the above image I'll point out is the red box containing the pages 5-7. Traditionally, in comics and manga, you'll want to set that hook as fast as possible so that your page to page retention levels out about pages 5-7. By that point, your readers should be committed, and you should have a very gradual decline after that. We can see that I don't have that here if I'm entirely honest. So I have some work to do, as a creator, to figure out what's not connecting with my readers. You also should think about what are your goals as a creator for this? I personally aim for 90% page to page retention. This means:
Out of everyone who read page 2, I want 90% of them to reach page 3.
Out of everyone who read page 3, I want 90% of them to read page 4 and so on.
If I actually do the math, I have a pleasant surprise:
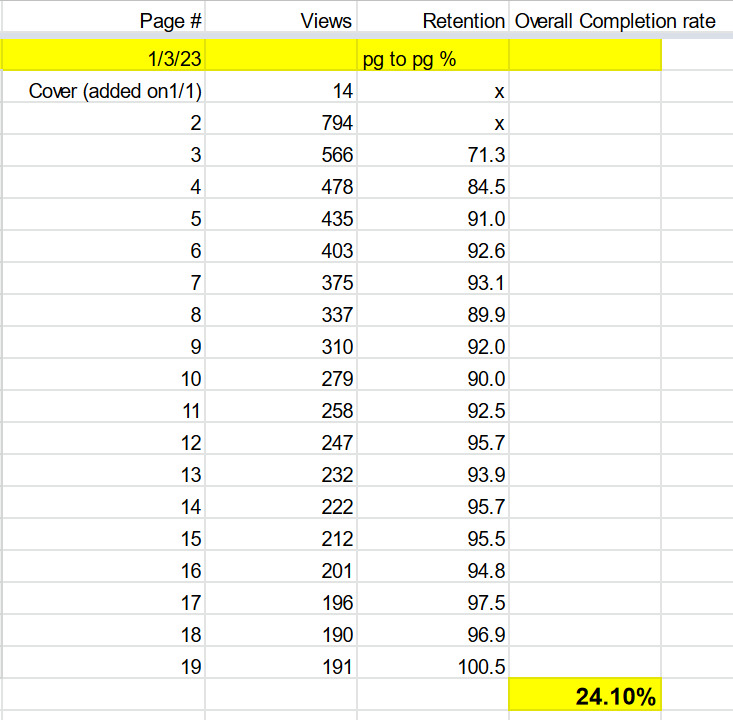
Of all who read page two, 71% read page 3.
Of all who read page three, 84% read page 4.
Of all who read page four, 91% read page 5.
All pages after that havea 90%+ page to page retention rate! I've met my goals!
My manga is performing better than I thought it was! So, here's what I've learned just looking at my analytics today:
- I've done very well on Twitter these last 4 days or so. That's great and there will be more opportunities to post art shares. I should take advantage of those chances.
- My manga is meeting the average completion rate so far. It's right in the middle, but I want it to improve still. I should try to be more active and keep an eye out for any pages with and extra sharp drop off.
- My page to page retention rate goals have been met as well! While 90% is good, can I make them better? Can I make 90% occur even sooner than page 5? I'll have to keep experimenting and try!
Acquisition Sources #2
If you scroll down below the analytics for your release, you can find another set of Acquisition Sources. These will be specifically for the release and timeframe you have chose. It's a really great way to check to see if your posts for your brand new release you just made public are working and bringing in new readers!
That said, be considerate of your followers and give them about 24 to 48 hours to read your work. Sometimes people ignore notifications, check them after work or on lunch breaks. With readers all over the world, it's hard to tell what anyone is doing at any given time. So be patient if you don't see results right away.
Weekly Analytics
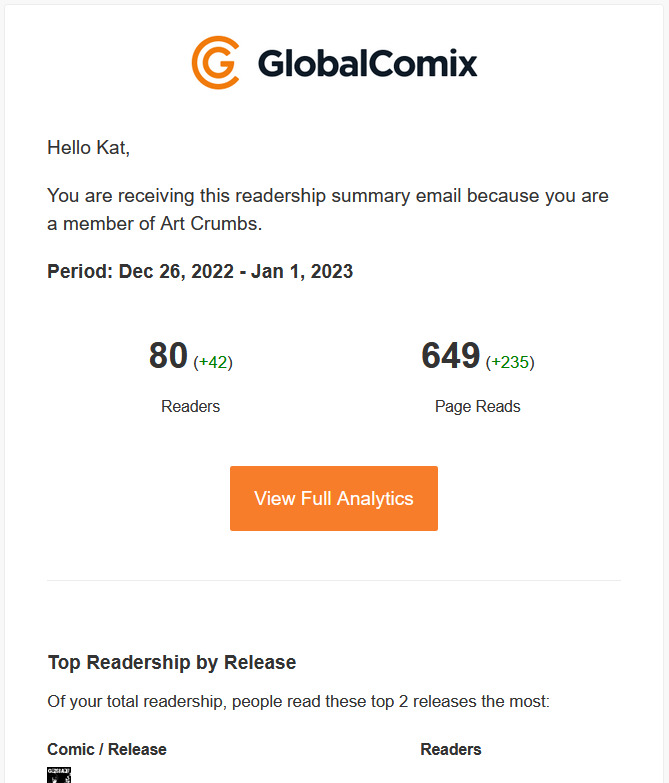
Each week, you'll get an email about your Weekly analytics from GlobalComix. This email will look roughly like this when you open it. There's some information in this email that isn't given in the analytics areas I mentioned previously, namely the Top Readership by Release, Top Country, and Readership by Device.
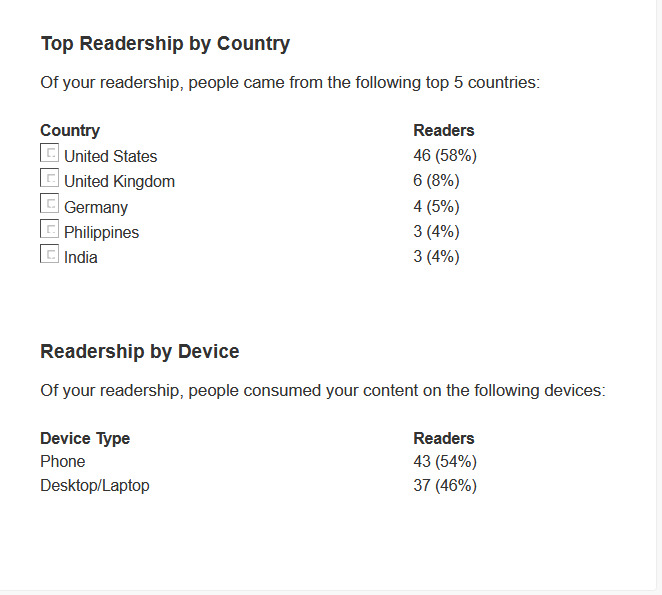
Why do you need to know countries?
If you have a very active country that isn't your own, you might want to consider posting to work with that country's availability or ideal posting times. It also could be an indicator what languages you could offer / translate into that might get the best results! For example, the United Kingdom is one of the countries I see a lot in my analytics. Maybe it might be worth a try to post at a better time for them? I also have a decent amount of German readers and Germany appears in most weeks. It might be worth it to look into a German translation!
Lastly, devices, knowing which device your reader is using will be invaluable to you.
Especially with the upcoming release of the GlobalComix App, knowing which device is the most used can give you insight into the behavior of the readers. Usually, I have a lot of Desktop readers, about 60%+. However, this week, I had almost the reverse, about 54% on phone. This isn't too surprising however, considering where a lot of my views came from, Twitter, due to the post that did exceedingly well over the weekend.
See how all of your analytics are interconnected!? It's amazing that, by peicing together various numbers and stats, we can get a rall comprehensive picture on how a comic or manga is performing. With the use of UTMs we mentioned in our last Article, we can use our analytics to the best of our ability to look at how many overall page reads, readers, and visitors we are getting and how many come from each source. We can also change the time frame to narrow down specific days to help identify marketing campaigns that did well and need to be replicated to attempt more success down the road.
I hope that this entire Self-Promotion and Marketing series has been help to you.
- If you missed the last article about using Custom UTM likes, you can find it here.
- If you want to start from the beginning, you can find that here!
- You can also find all of our education series here.
- You can find Twitter Analytics here. I highly recommend it.
Upcoming articles will focus on more GlobalComix tools that creators have at their disposal for making the most of the platform! If you have any questions, please leave a comment below!